

silx compare#
Purpose#
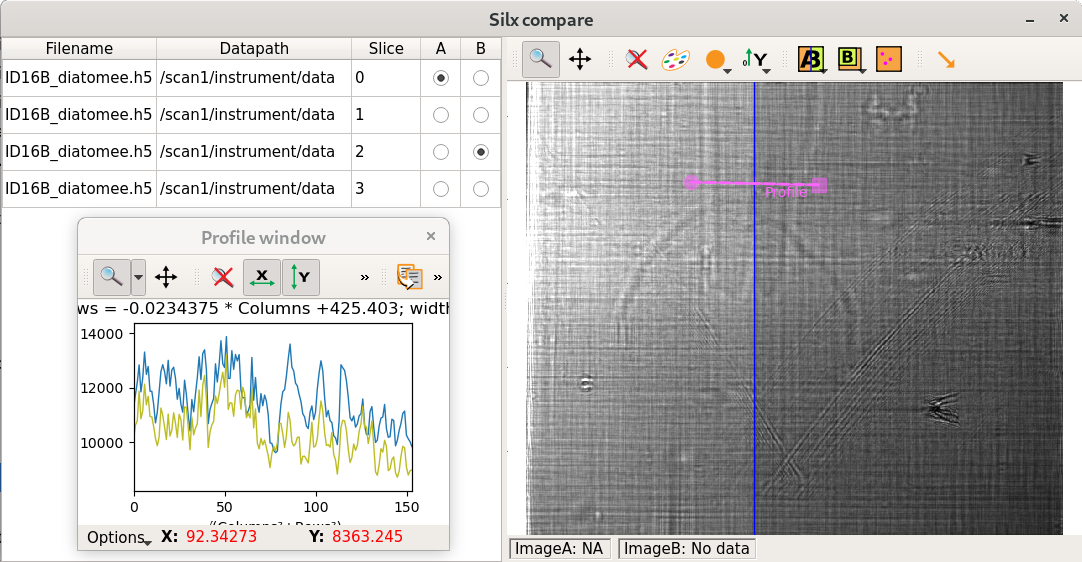
The silx compare command provides a graphical user interface to compare 2D data from files.
This tool allows you to list land open multiple datasets.
Comparison Modes#
Two selected datasets (labeled A and B) can be compared using different visualization modes:
Vertical Compare Mode#
Splits the display horizontally into two panels:
Dataset
Ais displayed on the left sideDataset
Bis displayed on the right side
Horizontal Compare Mode#
Splits the display vertically into two panels:
Dataset
Ais displayed at the topDataset
Bis displayed at the bottom
Color-Encoded Difference Modes#
Blue/Red — Color scheme highlighting positive/negative deviations
Yellow/Cyan — Alternative to Blue/Red color mapping for difference visualization
Raw — Unprocessed concatenated data without color encoding for direct inspection
More#
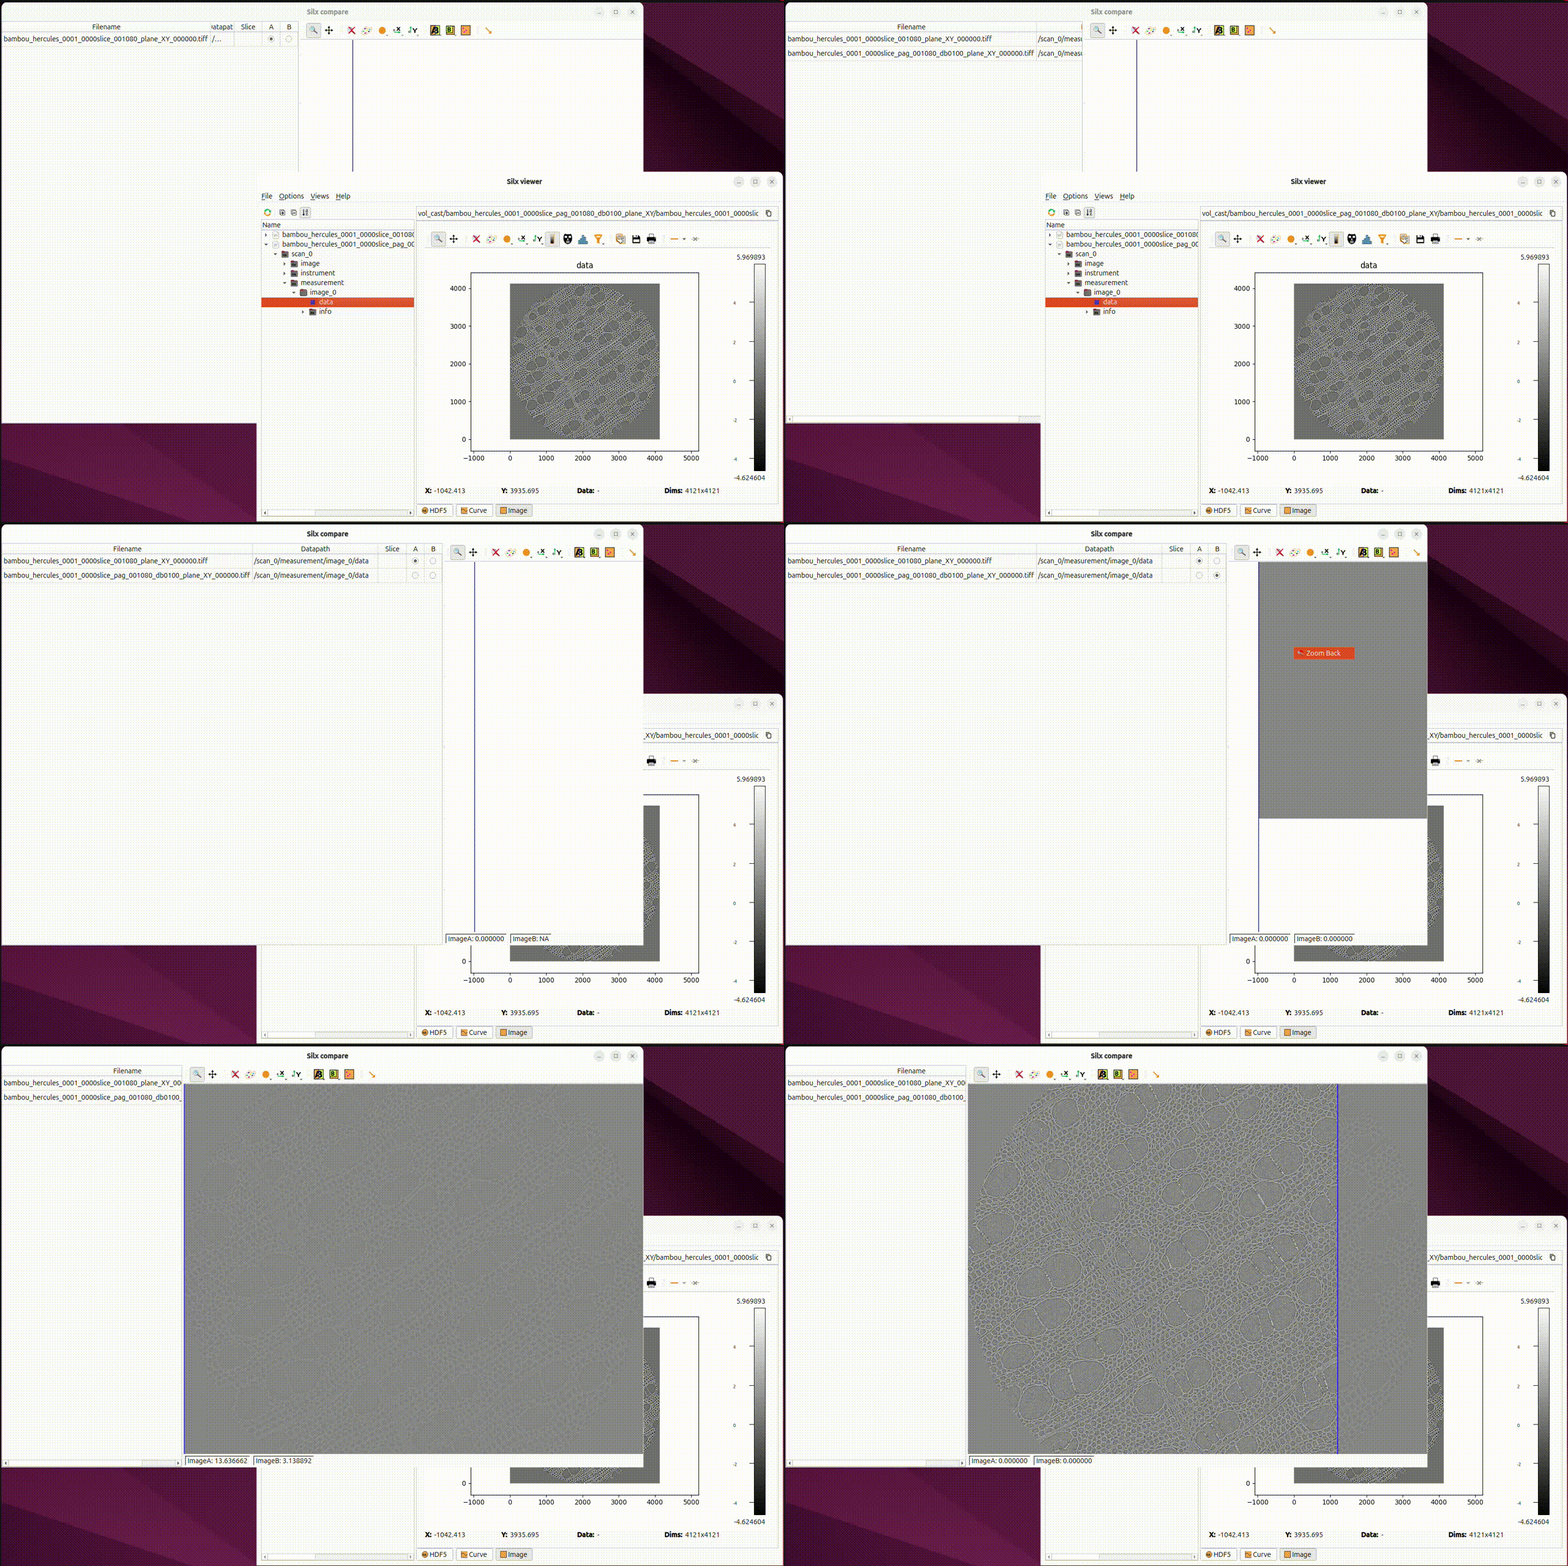
You can add files by dragging and dropping them from silx view.
Usage#
silx compare [-h] [--debug] [--use-opengl-plot] [files [files ...]]
Options#
- -h, --help
show this help message and exit
- --debug
Set logging system in debug mode
- --use-opengl-plot
Use OpenGL for plots (instead of matplotlib)
Examples of usage#
silx compare "silx://ID16B_diatomee.h5?path=/scan1/instrument/data&slice=0" "silx://ID16B_diatomee.h5?path=/scan1/instrument/data&slice=1"